Analytics Overview
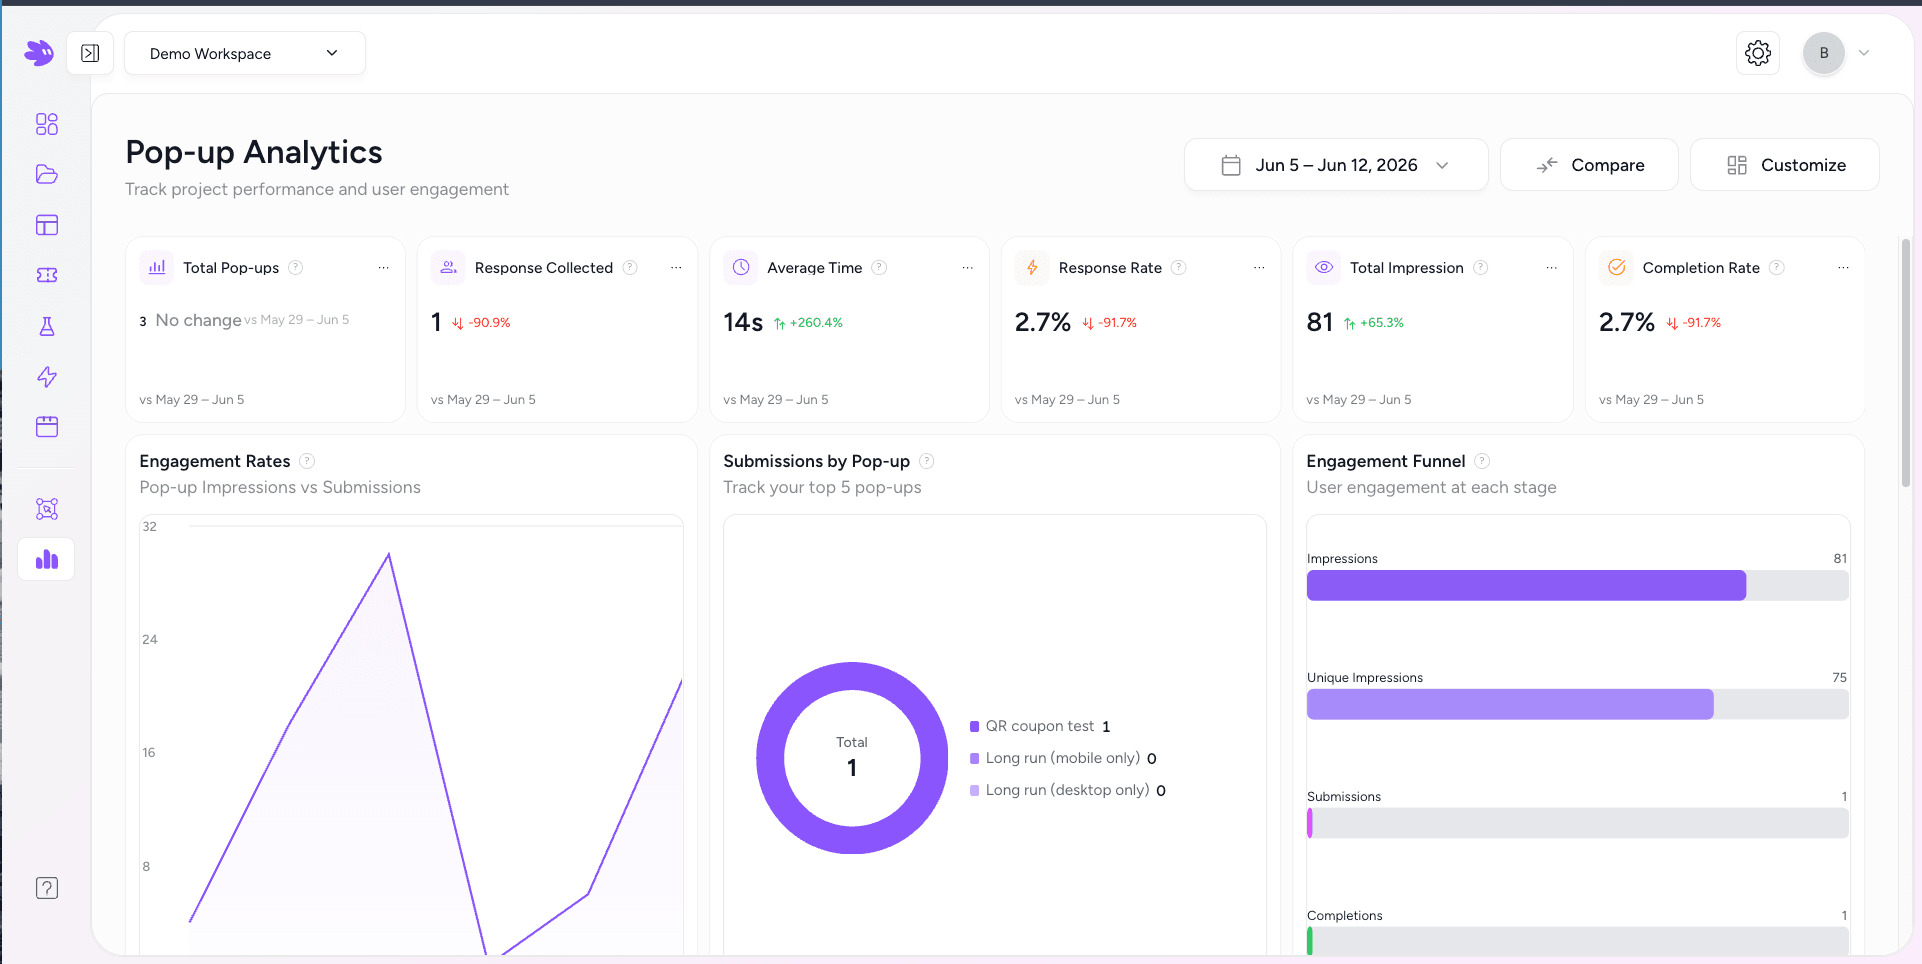
The Analytics dashboard shows impressions, responses, and response rate for all your widgets. Filter by date range and compare against any prior period.
Metrics explained
| Metric | Definition |
|---|---|
| Total Pop-ups | Number of distinct widget projects that have received at least one impression in the selected period. |
| Response Collected | Total number of form submissions across all projects. |
| Response Rate | Responses / Impressions. The percentage of widget views that ended in a submission. |
| Completion Rate | For multi-page widgets: users who completed all pages / users who started. A drop here often indicates friction on a specific page. |
| Total Impressions | Total number of times any widget was rendered — counted once per page load per unique session. |
| Average Time | Mean time from first render to submission, in seconds. Excludes sessions that never submitted. |
Date range
Click the date picker in the top right of the Analytics page to select any custom range. The default is the last 7 days. All metrics and comparison values update automatically.
Compare mode
Click Compare to overlay a prior period. Jule automatically selects an equal-length prior period (e.g. comparing Jun 4–11 shows May 28–Jun 4 as the comparison). Each metric card shows the delta value and trend direction.
Per-project analytics
Go to Analytics → Projects to see the same six metrics for a single widget. Click on any project name from the Projects page to jump directly to its analytics view.
Analytics sections
- All Pop-ups — aggregate metrics across all popup-mode widgets.
- All Preferences — metrics for preference center widgets specifically.
- Projects — per-project breakdown table with impressions, responses, and response rate per widget.